Cryptocurrencies: 852,583
Exchanges: 1,065
Market Cap: $2,483,709,717,173
24h Vol: $102,421,714,782
BTC Dominance: 50.78%
ETH Gas: 13 Gwei

Guide to Volume Price Analysis | Cheat Sheet
Do you consider yourself a successful trader that has a lot of experience? Or are you struggling to succeed? Well, if you are an experienced trader, then you probably know how vital volume price analysis is. On the other side, if you are a beginning trader struggling with trading, then you have come to the right place.
The first thing you need to acknowledge before you invest money in futures, stocks, or other tradable elements it that with the tremendous potential rewards, there are also significant potential risks involved. Moreover, emotions and stress are two factors that usually can get in the way. However, there are many ways you can improve your strategy.
Typically, in trading, there are two leading indicators – volume and price. Experienced investors know how powerful and essential these indicators are. Moreover, they use them to anticipate the market’s next move. So, if you want to learn more about the Volume Price Analysis, then keep on reading.
Volume Price Analysis
Nowadays, many investors are unaware of this effective analytical method. Moreover, using it, you can validate and forecast future price action. Further, it allows investors to look deeply into the market structure. And volume is the basis of the market structure. In fact, it applies to all markets. Therefore, Volume Price Analysis can be used for every market.
Generally, the price change is depending on the difference in the supply-demand ratio. The price/volume relationship is what investors should always keep an eye on. With the Volume Price Analysis, you can quickly determine buy/sell signals as well.
As we mentioned earlier, Price Analysis focuses on the relationship between volume and price. Further, the analysis of volume allows you to predict what areas the price can react in the future.
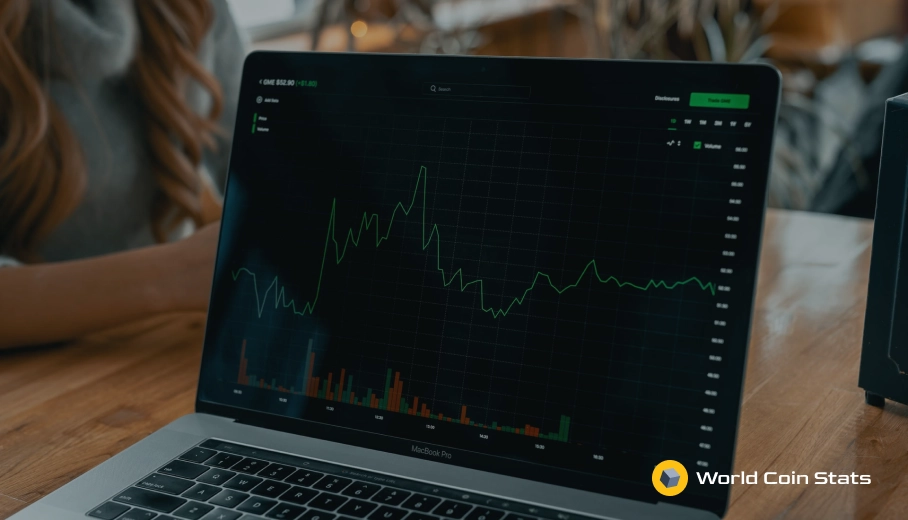
Typically, you have to focus on the right charts. Also, don’t use too many charts as they might confuse you. By focusing on the right charts, you will have better odds. For example, the Candle Volume Chart is a great choice. Currently, most technical analysis platforms offer this chart type.
Moreover, the relationship between demand and supply is significant when it comes to trading. Demand and Supply can be used to analyze the potential movement in price.
Here’s a list of things you need to learn if you want to improve your trading strategy.
Charts
-
- Types of Charts (Which is the right for you?)
- How to Understand Chart Context
- Why using Multiple Time Frame Analysis is essential?
Candle Volume Chart
-
- What is Candle Volume Chart?
- How can you use it?
Learn
-
- How to Analyze Overall Price Structure
-
- Supply and Demand Law
- Effort vs. Result Law
- Cause and Effect Law
- Bearish vs. Bullish Moves
- Law Of Supply and Demand
demand>supply=prices will rise to meet the demand
supply>demand=prices will fall, and the oversupply will be absorbed as a result
-
- Law of Effort vs. Result
Every action has an equal and opposite reaction
-
- Law of Cause and Effect
To have an effect, you first must have a cause
The effect is in direct proportion to the cause
As Warren Buffet has said: “The key is having more information than the other guy – then analyzing it right and using it rationally.” So, make sure you learn how to implement the mentioned above laws in your trading. Once you broaden your knowledge, you can combine what you have learned with your existing trading strategy – including the volume price analysis.
Bottom Line
Volume Price Analysis is a successful method used by many traders. More importantly, it has proven to be working. So, don’t try a new approach to trading that will likely disappoint you. Instead, learn how to implement the Volume Price Analysis in your trading strategy. This analysis has been used for more than 100 years. More importantly, it has proved to be essential when determining the directional bias in the market. However, you must be patient. Understanding how Volume Price Analysis works takes time.

Related Articles
What is a Pip and What Does It Represent?
Do you know what the difference between “pips” and “pipettes” is? Even if you are a beginner in forex trading, you have probably heard of...
3 Top Penny Stocks To Buy in 2019
Penny stocks tend to be riskier and more volatile than other types of stocks. However, in 2019, experienced investors are interested in them. Why? Penny...

Are Bonds Safer Than Stocks?
Do you want to let your money work for you and grow over time? Well, investing in tradeable instruments such as bonds and stocks can...